When establishing the perfect order fulfillment KPIs and benchmark metrics for your warehouse operation, make sure you stay in your neighborhood. Don’t compare yourself to the Amazon’s of the world. You want to compare your fulfillment KPIs to other operations in your “neighborhood”.
Establish your neighborhood
- B2B, B2C or Both
- Industry
- Warehouse Size
- SKU Count
- Order Volume
- Order Profile
- Etc…
What Fulfillment KPIs to Measure?
There are so many warehousing KPIs and metrics that choosing the most impactful can be challenging. You want to ensure your order fulfillment KPIs makes sense for your operation and provide actionable data. Collecting and analyzing data is a time consuming task. Don’t waste your time on fulfillment metrics that don’t matter to you just because some “guru” told you that was the thing to measure.
Inventory management and order fulfillment KPIs should be a basis for ongoing and productive conversation within your organization. If reports are stuck in a shared folder somewhere and no one ever looks at them stop wasting your time. They should be used as a tool for improvement.
Most order fulfillment KPIs fall into one of four categories – Space, Throughput, Accuracy and Labor. Let’s talk about each:
- What Is It?
- How Do You Calculate It?
- Why It’s Important To You?
- How Other Operations Are Performing
Warehouse Capacity Management KPIs
There are two basic parts to capacity management KPIs – footprint and capacity. The footprint of the warehouse is fairly easy to measure. The key is turning the footprint into a cost. If you’re not sure what your floor space is worth, use this as a starting point:
| Location | Manufacturing Rent | Distribution Rent |
| Northeast | $9.44 | $14.75 |
| Midwest | $6.06 | $6.39 |
| South | $7.14 | $7.83 |
| West | $14.62 | $13.13 |
| US Average | $9.50 | $9.82 |
U.S. industrial space by region vacancy & asking rent year over year - updated Q3 2024
Warehouse usage measures the current capacity (in cubic feet). Capacity can help you understand when it’s time to explore expansion options before the warehouse is out of space and product is spilling into the aisles.
The capacity management KPIs are important because space costs money and organizations are constantly in search to optimize operations to improve the bottom line. Facilities are always looking for ways to expand their operations internally - making room for revenue generating activities (more manufacturing, additional quality checks, etc.) by shrinking the warehouse.
Capacity Management KPIs:
- Width of warehouse x depth of warehouse = Total Square Footprint
- Cost of Warehouse Space: warehouse footprint x cost per sq. ft. = Cost Of Warehouse Space
- Warehouse Cubic Feet Occupied/Warehouse Cubic Feet Capacity = Warehouse Usage
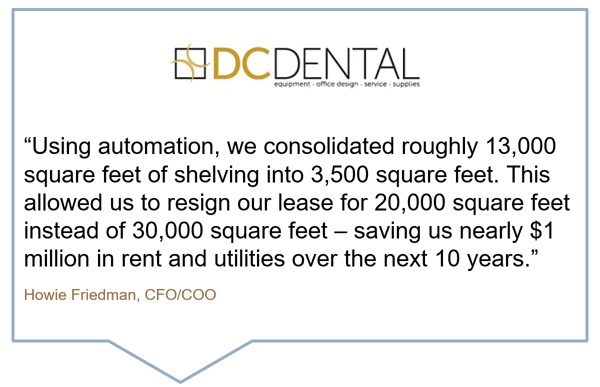
Capacity Benchmark Example: DC Dental
The DC Dental Neighborhood:
- Dental supply distribution
- 20,000 Sq. Ft. Facility
- 20,000 SKUs
- 2,500 lines/day (ability to pick 3,500 lines/day)
- 480 orders/day
Throughput KPIs
Throughput measures how many (parts, lines, orders) are completed in a specific time frame (hour, day) or by number of people.
Throughput is becoming a more important measurement as customer demand from B2C is bleeding into B2B. Years ago manufacturers and distributors had fewer criteria to meet to satisfy a customer. Today, customers want it all and more – increasing the demand for faster order fulfillment.
| Before | Now |
|
|
Throughput KPIs:
- Orders per Shift/Hours per Shift = Orders Picked Per Hour
- Lines per Shift/Hours per Shift = Lines Picked Per Hour
- Orders per Shift/Hours per Operator = Orders Picked Per Operator
- Lines per Shift/Operators per Shift = Lines Picked Per Operator
- Actual Ship Date - Customer Order Date = Order Cycle Time Hours
- Orders On-Time/Total Orders Shipped = On-Time Delivery Rate
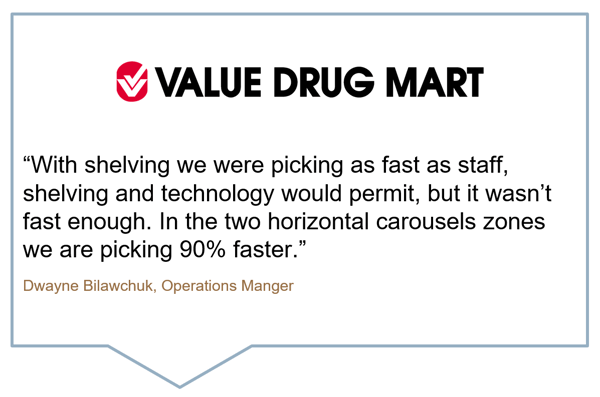
Throughput Benchmarking Example: Value Drug Mart
The Value Drug Mart Neighborhood:
- Central distribution center for pharmacy & front store items to over 300 retail stores
- 18,000 SKUs
- 60,000 Sq. Ft Warehouse
Order Accuracy KPIs
Order accuracy consists of two measurements – inventory accuracy and pick accuracy. Inventory accuracy measures your physical inventory on hand against the inventory recorded in your inventory management system. Order picking accuracy measures how often you are able to pick the correct part from inventory.
In a manufacturing operation, order accuracy leads directly to productivity. Missing parts due to inventory discrepancies or incorrect parts arriving at manufacturing can shut down the manufacturing line leading to lost time and money.
In a distribution operation, inventory discrepancies cause short picks leading to added shipping costs in and order delays. Mispicks lead to customer returns, increased costs and unhappy customers.
Order Accuracy KPIs:
- Inventory Discrepancies At Physical Inventory/Total SKU Count = Inventory Accuracy
- Picking Errors/Total Picks = Pick Accuracy
- Order Errors/Total Orders = Order Accuracy
- Perfect Deliveries/Total Orders Shipped = Perfect Order Rate
- Orders Filled Complete/Total Orders Shipped = Order Fill Rate
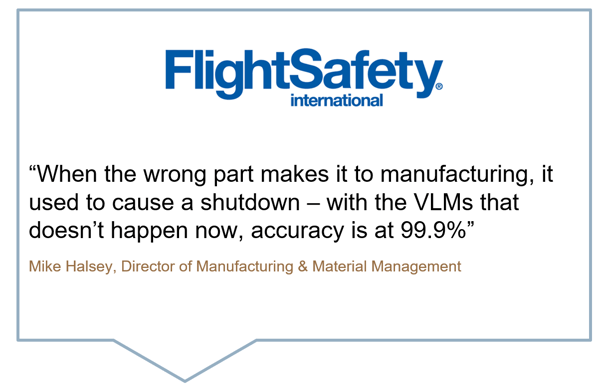
Order Accuracy Benchmark Example: Flight Safety
The Flight Safety Neighborhood:
- Manufacturer of full flight simulators, visual systems & displays
- 960 Sq. Ft. Stockroom
- 8,000 SKUs
- 100 Orders per Day
- 480 lines/day
Warehouse Productivity KPIs (Labor)
Labor is quite simply the cost of the people required to execute the tasks within the warehouse. Labor is generally the most expensive part of the order fulfillment operation and is therefore scrutinized closely by upper management.
Additionally, skilled and reliable labor is increasingly more difficult to find and retain. With the impact on COVID-19, a stable and reliable workforce is hard to find. Workers are having to stay home with children or care for infected family members resulting in a fluctuating labor pool that is difficult to manage.
Warehouse Productivity Metrics:
- Labor Salaries + Benefits = Yearly Total Labor Costs
- Yearly Labor Costs/Yearly Orders = Labor Cost Per Order
- Productive Time/Time Paid = Productivity Rate
- Contract Employees/Total Employees = Contract Employee Rate
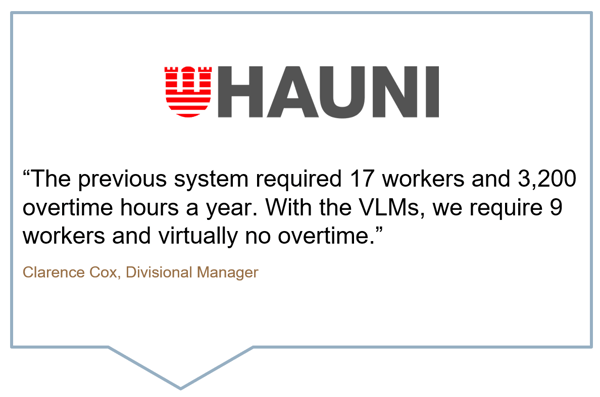
Labor Benchmark Example: Hauni
The Hauni Neighborhood:
- Global Manufacturer Of Production Equipment
- 3,180 Sq. Ft. Stockroom
- 16,000 SKUs
So now it’s up to you to decide:
- WHAT to measure
- HOW to measure
- WHEN to measure
Once you establish some order fulfillment KPIs you can move towards improvement strategies and goals. Here are a few tips to start on your improvement journey - 55 Warehouse Best Practices


